
China: An Ever-Growing Dominance in Global Trade
China dominates global trade with 730 products for which it accounts for more than half of global exports in 2023, far more than the EU, the United States, and Japan.
By Gianluca Santoni, Vincent Vicard
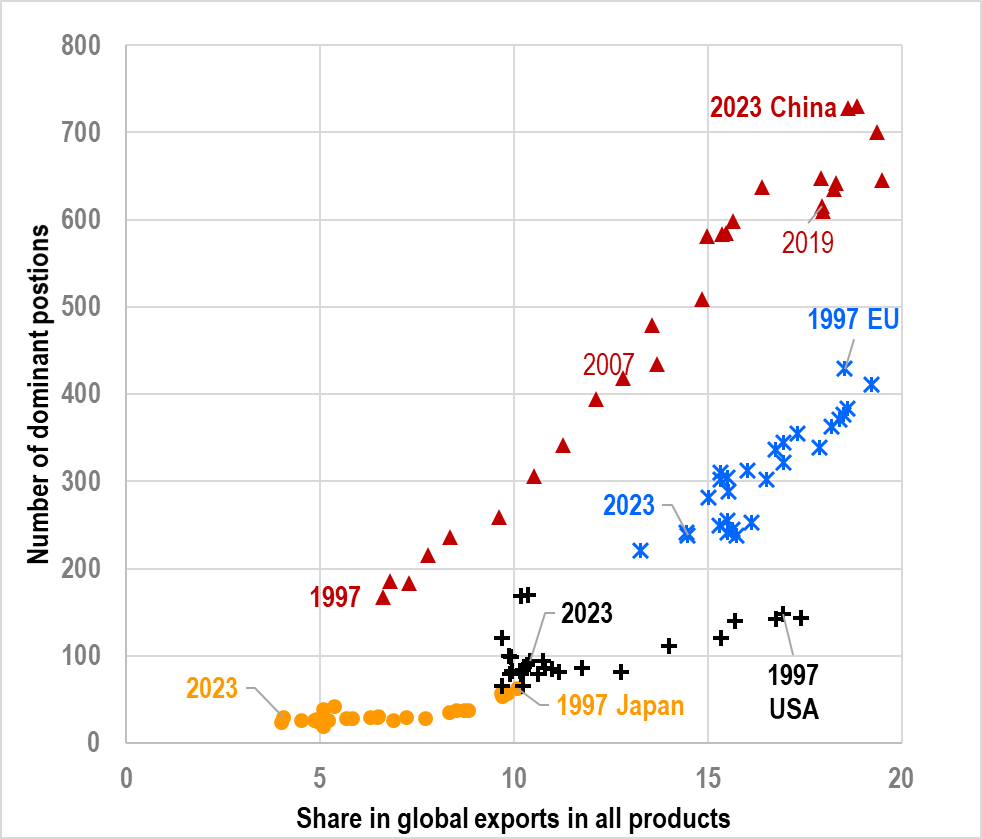
Since the late 1990s, China has seen a surge in its dominant positions, defined by products for which its share of global exports exceeds 50%: 730 products in 2023, compared to 238 for the European Union (EU), 94 for the United States, and 30 for Japan. These advanced economies have all seen their dominant positions decline significantly. At an equivalent market share in total global exports, China holds far more dominant positions than any other country in recent history.
Companies and countries dependent on Chinese products are thus exposed to risks in the event of trade tensions or export restrictions. However, the number of products for which China holds a dominant position has continued to rise since COVID-19, as it had 616 dominant positions in 2019. In response to this concentration, policies promoting reshoring, derisking or friendshoring are emerging to diversify supply sources and reduce dependencies.
To find out more, read Dominance on World Markets: the China Conundrum.
Reading the chart
Source: Authors' calculations from CEPII-BACI-V202501 database.
Trade & Globalization | Competitiveness & Growth | Emerging Countries >
> LE Graphique / THE Chart
Companies and countries dependent on Chinese products are thus exposed to risks in the event of trade tensions or export restrictions. However, the number of products for which China holds a dominant position has continued to rise since COVID-19, as it had 616 dominant positions in 2019. In response to this concentration, policies promoting reshoring, derisking or friendshoring are emerging to diversify supply sources and reduce dependencies.
To find out more, read Dominance on World Markets: the China Conundrum.
The Expansion of China's Dominance in Global Markets
Reading the chart
- The vertical axis represents the number of products listed in the Harmonized System classification (around 5,000 items in total) where the country holds a dominant position.
- The horizontal axis represents the country's market share in total global exports across all products.
- The 27 markers for each country/region correspond to the years from 1997 to 2023. In 2023, China held a dominant position for 730 products—nearly twice as many as the EU when it had a similar market share in total global exports.
< Back