
Tariff Protection by Industry Group: A Transatlantic Comparison
On average, the United States and the European Union (EU) apply relatively low tariffs. How do the levels vary by industry group ?
By Houssein Guimbard
In 2022, taking their preferential agreements into account, the United States and the EU applied a similarly low average tariff on imports from the rest of the world: 2.2%. However, a breakdown by industry group reveals specific protections in the agri-food and textile sectors. The EU provides greater protection for its agriculture (11.3%) than the U.S. (5.3%), while average U.S. tariffs are higher in textiles (10.1% compared to 5.7% in the EU). In other sectors, the tariff and trade structures of both economies show low and very similar protection levels, with duties ranging between 3.1% and 0.3%. For example, the transport equipment is protected by an average tariff of 3.1% at EU borders and 3% in the U.S. The new and more protectionist U.S. trade policy is likely to change this landscape.
To find out more, see CEPII Profiles.
To find out more, see CEPII Profiles.
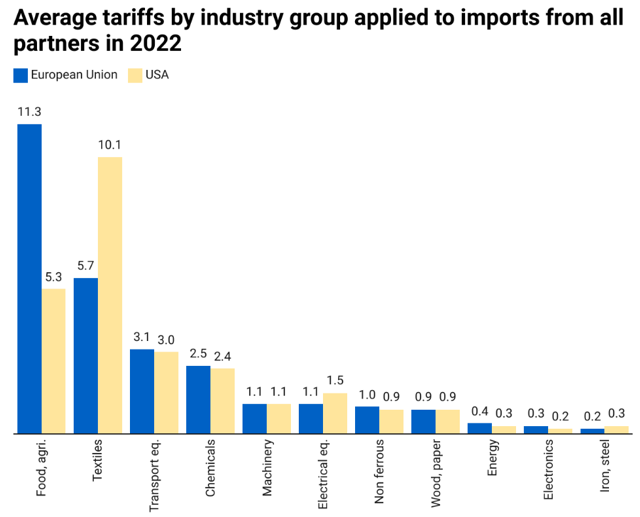
Notes: The industry groups are sorted according to European tariff levels. The average tariff includes all preferential tariffs for each product-partner in each industry group. Calculated as a weighted average based on reference groups from the CEPII’s MAcMap-HS6 database, it is expressed as a percentage (see Guimbard et al, 2012). Temporary tariffs, such as anti-dumping or countervailing duties, are not considered in this calculation.
< Back